

In the last edition of Wattle & Quoll, we gave some background to the Hydrologic changes that have occurred since European Settlement with drainage and wetland behaviour in our Project Area (Ref: W&Q Birak 2025 https://peel-harvey.org.au/peel-main-drain-and-serpentine-wetlands-%e2%94%80-hydrology-and-drainage/). The Project Area is shown in Figure 1, and in this edition, we explain one of the simple trial-remedies that has been installed and the positive impact that it is having on the Northern Wetlands.
Works on the Northern Wetlands stem from learnings from the our ‘Mayfield Project’ that ran from 2018 to 2020 in conjunction with Department of Water and Environmental Regulation.
The Mayfield Project used engineering techniques to improve selected wetlands on the Swan Coastal Plain (SCP), holding Winter runoff in them for longer and reducing the concentration of nutrients. The philosophy of the project was to attempt to reverse the decline in wetland health that is largely due to the efficient SCP drainage network built in the early 1900’s, drainage which has been reducing water in wetlands.
The Mayfield Project sites were located from Hopeland down to Cookernup. In the project area, 14 sites were investigated and seven proceeded to implementation and construction.
Of those sites that were implemented, five consisted of Drain/Wetland systems where the selected solution increased the volume of water held in the wetland and also improved its water quality.
Northern Serpentine Wetlands
The Northern Wetlands were riverine pools in the original Serpentine River prior to when the Serpentine drainage construction began in the 1920s. Until early 2025, this wetland system behaved in a similar way to the Southern Wetlands that were described in the last edition of Wattle & Quoll, with very efficient drainage that quickly routed the water from the catchment and wetlands towards the south and out into the Serpentine River. These Northern Wetlands have a catchment area of 37.2 ha (0.37 km²) and the wetlands are shown in Figure 2. In this Figure, monitoring sites are also shown and the wetland imagery is from 31 March 2025 by which time the wetlands were just disconnected and highly concentrated pools.
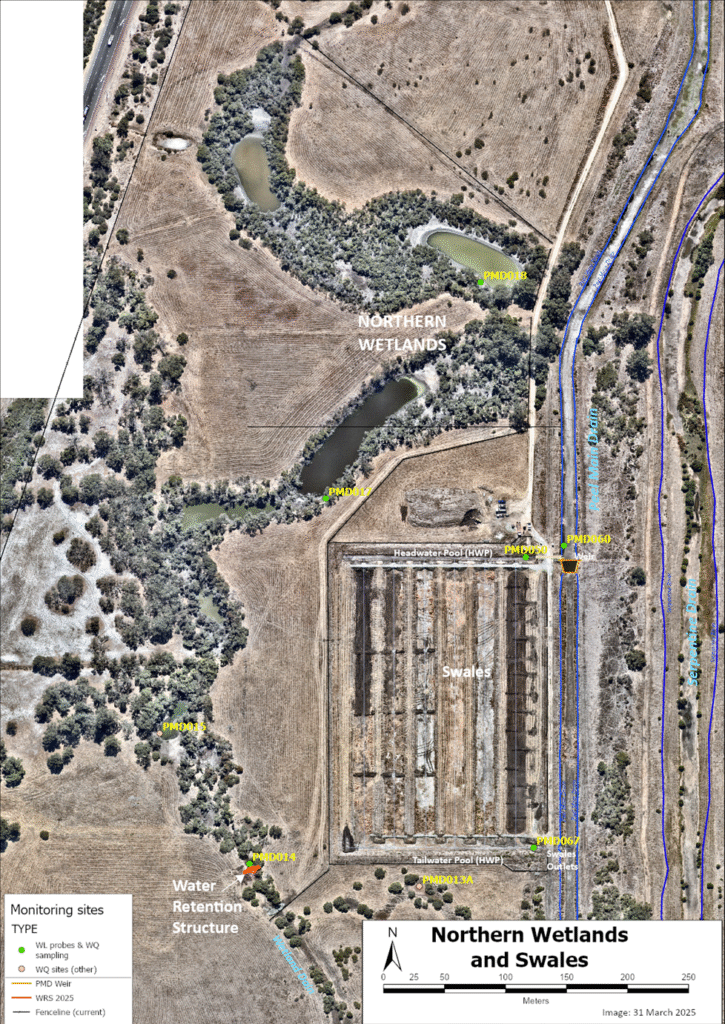
Figure 2 – Northern Wetlands and Swales
In the Northern Wetlands, water quality sampling and water level monitoring commenced in early 2024 and focused on the two main waterbodies and sampling occurring at PMD017 and PMD018. This monitoring was undertaken to define the wetland health and understand its behaviour prior to development of any conceptual proposals to improve their health. What quickly became apparent was how the water remaining in the wetlands after winter evaporated and concentrated, exacerbated by the impact of water draining away to the south in winter/spring.
Ideally, a natural wetland on the Swan Coastal Plain should be full until late Spring each year (~November). However, in the Northern Wetlands water levels began falling by mid August 2024 from a peak water level of ~1.7m AHD, by November they were 350mm below full and by May were only ~150mm deep and highly concentrated.
Modifications to drainage
In March 2025, following our success at securing grant funding of $1,987,210 through the Australian Government’s Urban Rivers and Catchments Program, a small 0.6m high clay bank (Water Retention Structure (WRS)) was constructed in the drain to the south of the Northern Wetlands (see location in Figure 2) and is shown in operation in Figure 3. The WRS is designed to allow excess water to overflow downstream as a flushing mechanism, but primarily to mimic a natural wetland over the Winter-Spring period with high wetland water levels and to mimic natural behaviour and minimise water quality concentrations.

Figure 3 – Water retention structure in operation; 14-08-2025
The 2024 and 2025 wet seasons actually had similar behaviour, while both seasons broke in early June, water levels in the Northern Wetlands did not increase significantly until late July and the peak water levels were not reached until 18-25 August in each year. While in both years the wetting-up behaviours were very similar, it was in the inundation period from September where wetland behaviour differed significantly.
In the three-month period from early August 2025 till early November, water levels in the Northern Wetlands remained near full (~1.70m), while in comparison without the WRS, by early November 2024 the water levels had dropped to 1.35m (0.35m lower). This is a loss of 34% of its volume. The WRS setup the improved wetland conditions for Spring and Summer. Figure 4 shows the comparable differences in water levels over the two seasons while the photos of Figure 5 show visually the differences with the whole far bank inundated 0.6m higher in November 2025.
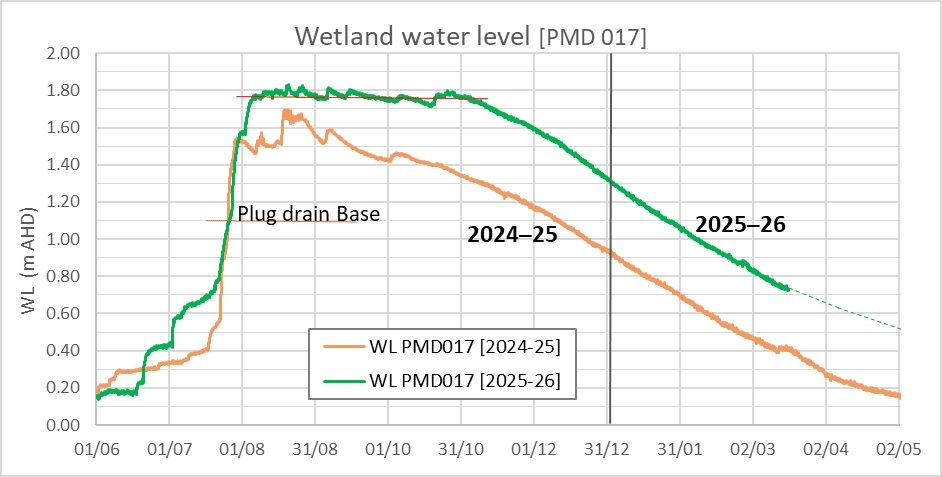
Figure 4 – Water levels by date in the Northern Wetlands

Figure 5 – View of Northern Wetland from sampling point 017
It is particularly important that fringing vegetation around the wetlands has a good inundation until late December. Particularly during the Spring growing season. At the end of 2024, water levels were only 0.9m AHD, while at the end of 2025 they were 1.3m.
Water Quality implications
There was a significant impact in Water Quality generally, with concentrations much lower between the two years. Figure 6 shows the difference in salinity where by March 2026, the salinity was only 55% of what it was the previous March.

Figure 6 – Salinity by date in the Northern Wetlands
With Total Nitrogen (TN), the results were similar with the TN when it is concentrating now only 55% of what it was last year. Note, the TN concentrations in August-November each year are Low-Moderate.

Figure 7 – Total Nitrogen by date in the Northern Wetlands
With Total Phosphorous (TN) shown in Figure 8, the results were highly variable. In the period July-November, the concentrations were Low-Moderate so not a concern.
However, the high concentrations in February and March seem to be anomalies, but may be simply due to animal and bird activity which have been seen recently and likely due to the high water levels in the wetlands.
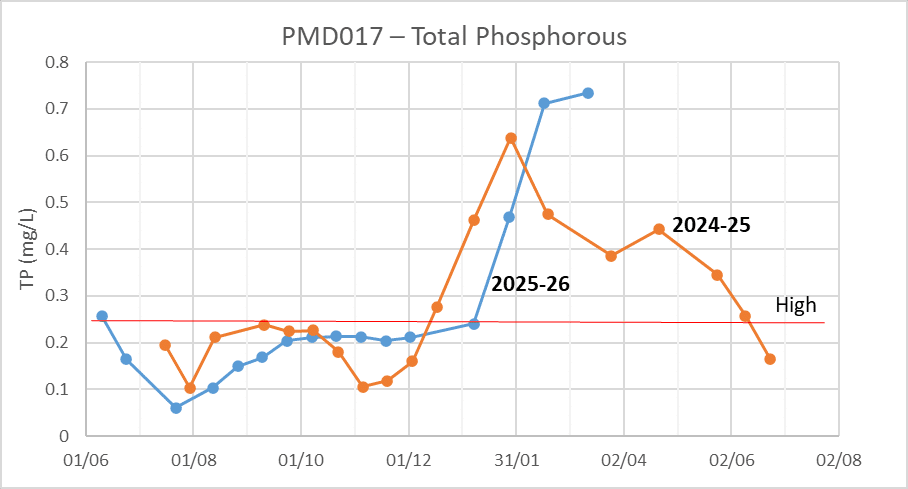
Figure 8 – Total Phosphorous by date in the Northern Wetlands
Water temperature was recorded at both the base of the wetland (Figure 9) and surface. The surface temperatures are consistent in both years as the sun heats the water surface no matter how deep the water is. However, the deep temperature is consistently lower as the water depth is 0.40m deeper in 2025-26 compared to the previous year. Note that 24°C is the upper maximum that a wetland should be at.
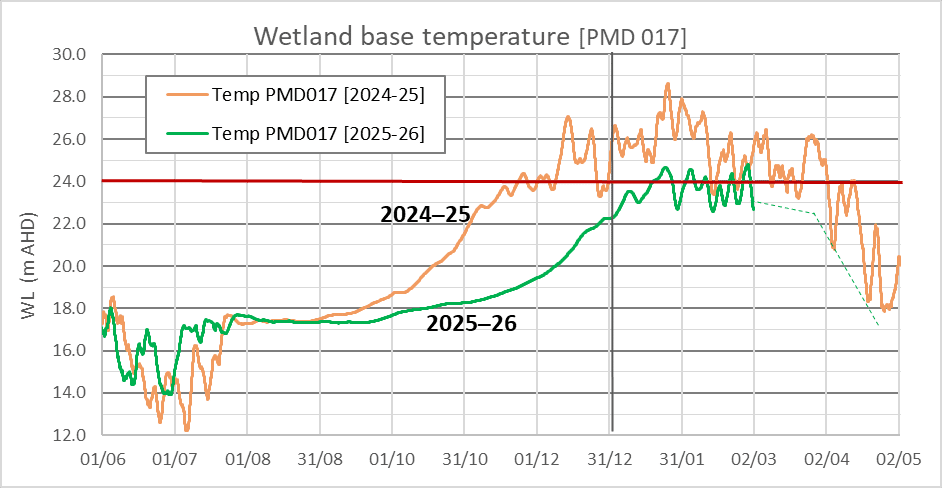
Figure 9 – Bottom water temperature by date in the Northern Wetlands [PMD017]
The final image is an aerial taken near the peak water level in August 2025 (Figure 10). It shows the wetlands as we would like them to be! Note that there is no connection between the Peel Main Drain and the wetlands and all inflow to the wetlands is from the local catchment.
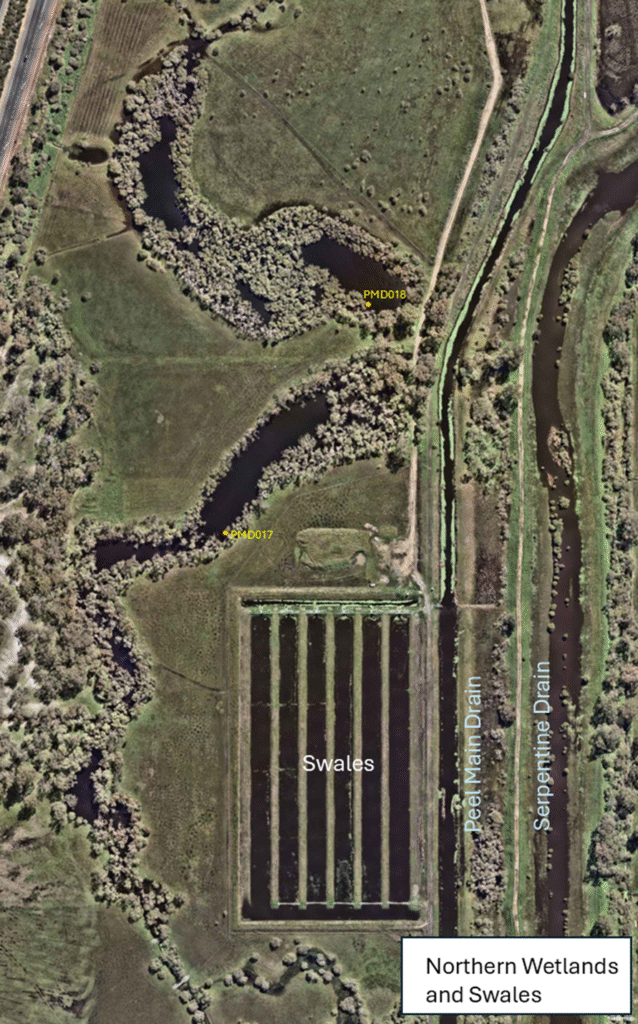
Figure 10 – Northern Wetlands in winter 2025 [16-08-2025]
Conclusion
The results of the simple modification in catchment drainage is a massive improvement in water levels, water quality and what we hope is an improvement in the riparian zone around the wetlands. In the next couple of months PHCC are to plant an extensive area around the wetlands with native species (sedges, rushes, shrubs and trees). The area where planting is to occur is now fenced-off and the added water in the soil should significantly help survival in what was once a severe environment for plants to survive.
It is hoped that the monitoring already undertaken will allow other wetlands in the highly drained Swan Coastal Plain to be recovered.

Acknowledgement
This project is funded by the Australian Government’s Natural Heritage Trust under the Urban Rivers and Catchments Program, with the support of the PHCC and the Western Australian Department of Water and Environmental Regulation.